My first book, Eight Flavors: The Untold Story of American Cuisine will be released December 6th, but is available for pre-sale right now. To create the book, I researched the eight most popular flavors in American cooking: black pepper, vanilla, chili powder, curry powder, soy sauce, garlic, MSG, and Sriracha. When I dived deep into each of these eight topics, I often found fascinating new information and recipes–some of which didn’t make it into the book. So over the next few months, I’ll be publishing this exclusive content on my blog! If it whets your appetite to read the whole book, make sure to get your own copy here.
The premise of my new book, Eight Flavors, is that American cuisine can be illustrated by its most commonly used flavors. One of the most freqeunt questions I get about the book is how I picked my eight flavors to focus on.
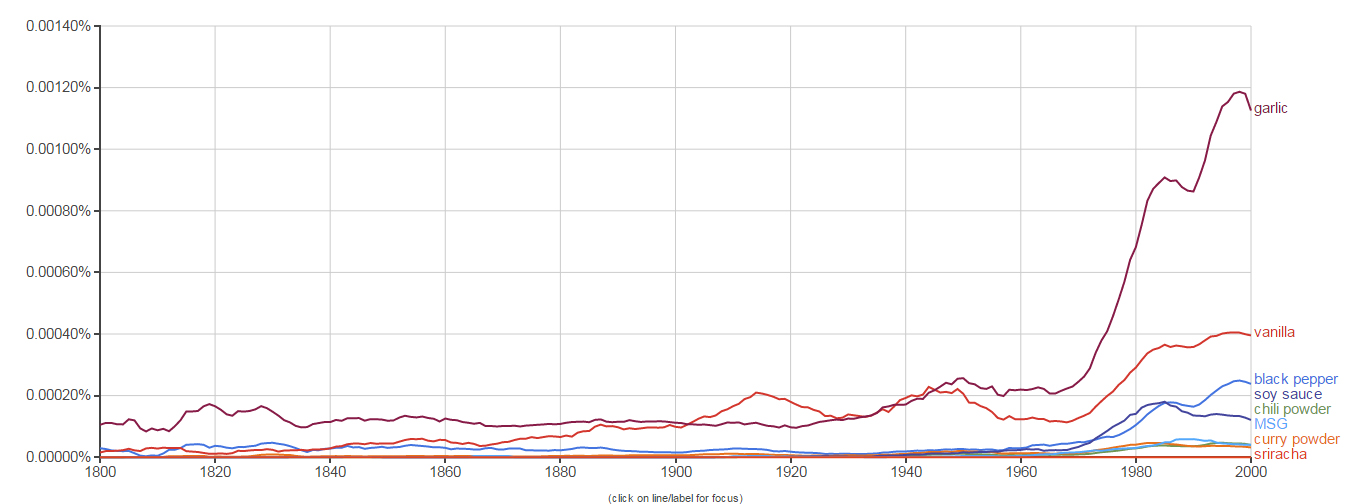
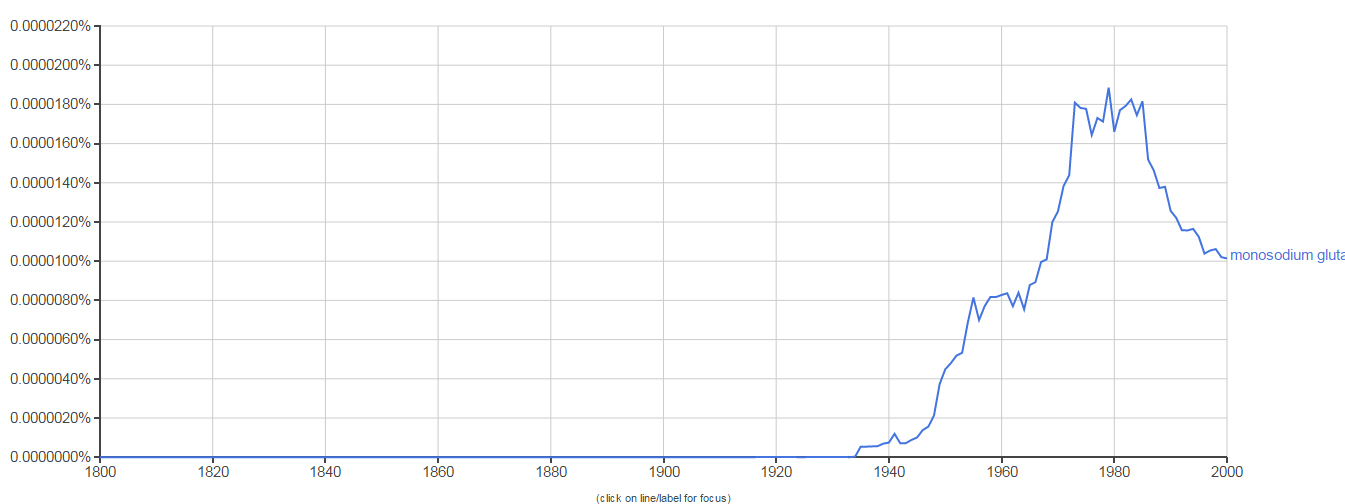
When I began my research, I made a timeline of recipes from my respectable collection of cookbooks, dating from Amelia Simmons’s American Cookery, the first cookbook published in this country in 1796, all the way through modern American standards like How to Cook Everything by Mark Bittman. I flipped through these cookbooks from different eras: the 1800s, 1850s, 1900s, and 1950s, selecting the most influential tomes from those periods, like Mary Randolph’s The Virginia Housewife; Fannie Merritt Farmer’s The Boston Cooking-School Cookbook; and James Beard’s The Fireside Cook Book. I looked for ingredients that significantly affected the flavor of the recipe. After I made a list of commonly used flavors, I plotted them on a graph with the help of Google’s Ngram Viewer, which visualizes the frequency of words in all the books Google has digitized. I set the sample size to American books from 1800 to 2000. When I built the graph of American flavors, it revealed which ones were used the most frequently (and for all practical purposes, were the most popular), when flavors entered our lexicon, and how some grew in popularity while others disappeared. After all was said and done, the results revealed eight winners—flavors that were the most popular, and had never significantly waned in their popularity.
The graph at the top of the page shows them all, and gives a really clear sense of how these flavors entered into our kitchens chronologically. I love in that top graph how clear garlic’s popularity is over the other flavors I talk about.
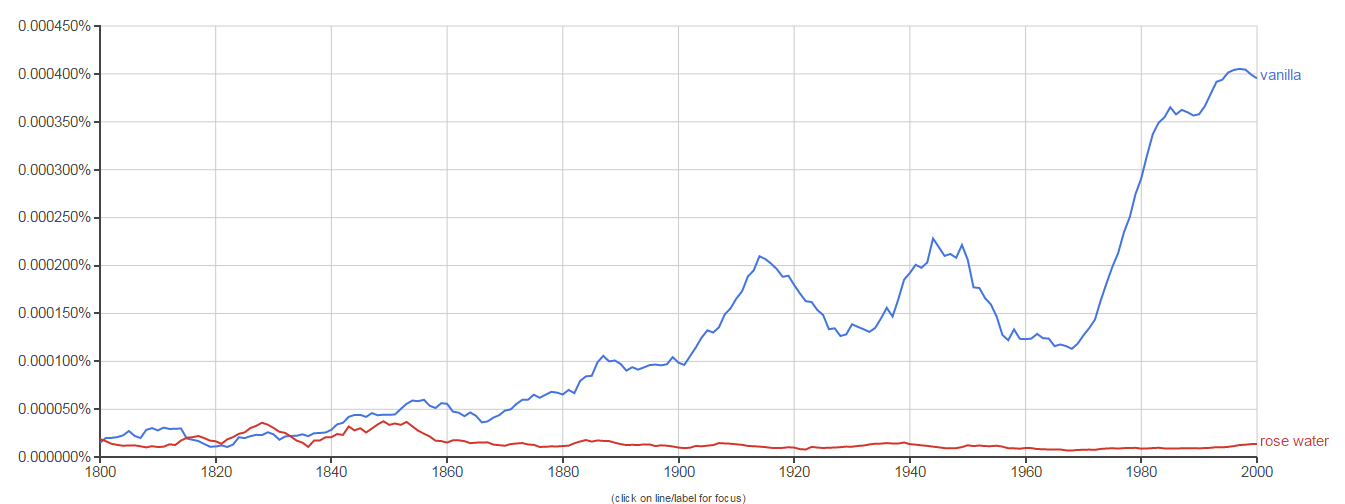
I write in the book that vanilla replaced rosewater in American kitchens, and you can see that below.
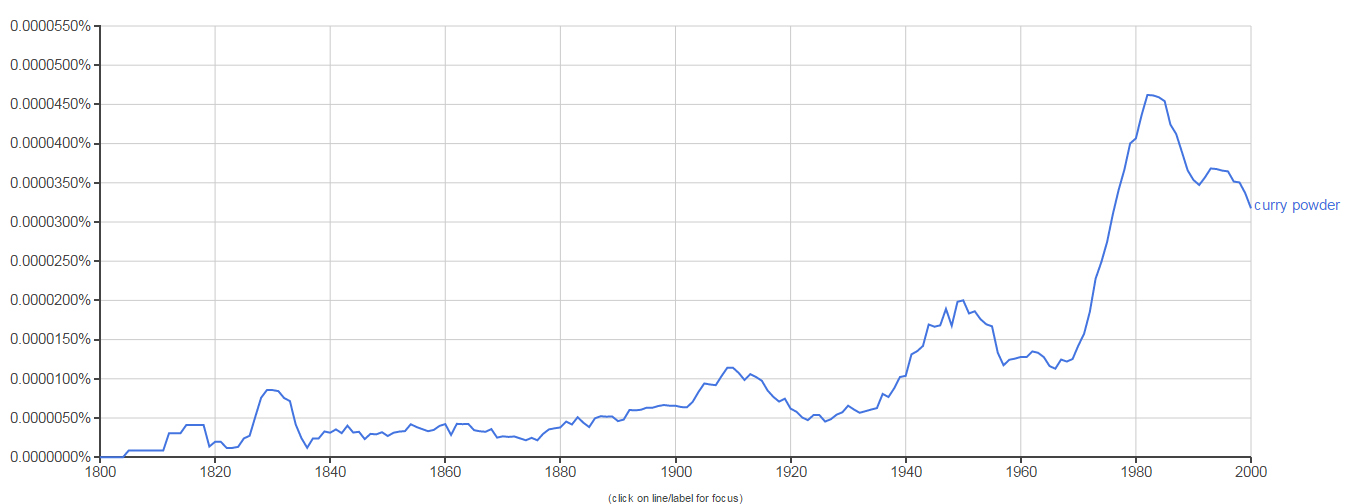
And look at how long curry powder has been used in the U.S.!
And look at how our use of MSG has declined in the last 30 years. I unpack the perception that MSG is “bad” for you in my book, but you can also listen to some great podcasts on the topic here.
These graphs gave me a quick and dirty way to identify trends over time, and a wonderful way to visualize how our larger culture was affecting consumption of these ingredients, and vice verse.
